Introduction to R and RStudio
Stuart Demmer
28 July 2018
Introduction to R
What is R and RStudio?
The term “R” can refer to both a programming language (a derrivative of the “S” language) and the software console which is used to compile and interpret the code written in the “R” language. To interact with R we will use the RStudio integrated development environment. Before we install the RStudio IDE we first need to install R. RStudio is a piece of software known as an integrated development environment (IDE) which expands on the basic R console. For help understanding RStudio have a look at this cheatsheet.
Why learn and use R?
Many people have heard rumours that R is difficult and that it is much easier (and possibly better) to stick with menu driven statistical programmes. But typing out your code has many great benefits for you and the people interested in your work.
1. Hardly any pointing and clicking
This might make R a little more challenging at the beginning but by learning the method behind the statistical analyses as opposed to memorising a list of menus in order to perform a particular function you will better understand what you are trying to do. It will also challenge you to know what you want to do before you actually do it. Another important aspect here is that because your instructions are written out as code, if you want to re-run an analysis all you need to do is just that, re-run it as opposed to cycling through menu options. R code is stored in things called scripts - think of these as recipes with each step written out. If you want to change a particular function or if you want to use different data all you need to do is change that part of your code in the script and then run it again and the change will be incorporated into producing a new output. Think about the challenges with doing that in SPSS or other menu-driven statistical packages… Writing out scripts lets you to map out your analysis before actually running it in full - you understand all the steps required to achieve a particular outcome because you commanded each step.
2. R is for reproducibility
That is a joke - but it could be. One of the fundamental aspects of scientific experiments is that your methods should be reproducible and that includes your statistical analyses (that is one of the reasons they are described in the methodology section). How often have you run something in SPSS and then tried to reproduce the results six months later? Thet is probably quite difficult to do. Using scripts in R keeps all your data and functions in one place allowing you to share your analyses with yourself and others when needed at the drop of a hat. There is even a growing movement to write entire documents, websites and books within R using the R Markdown package as a base.
3. There’s a package for that
Because R is opensource (that means it is free and anyone can access the underlying code) people from almost every academic discipline are using it and developing “packages” to perform specialised functions which normal statistical software packages cannot perform or which can only be performed using very expencive software. To give you an idea you can use R for data manipulation (something that takes hours to do in Microsoft Excel or Access), high quality data visualisation, multivariate analyses , and GIS. All the supplied links contain free tutorial content to give you a crash course and in some cases a more indepth series of lessons if you reuire. These are only the tip of the ice berg as you will likely see as you become more familiar with the R statistical environment.
4. R’s graphing capabilities
5. The fantastic fanbase
The online community actively supporting R and R packages is just phenomenal. Just about every error message that R produces can be solved with a quick Google search describing the problem. Three important places you will find useful are Stack Overflow - mainly for coding problems, cross validated - mainly for statistics problems, and the RStudio Community. These are all forums where people can ask questions and then other people quickly work to help you resolve the issue - for free.
6. It’s anomolous growth rate
It’s among one of the fastest growing coding languages and it’s not the most difficult to learn.
Installing R and RStudio
Go here to download the latest version of R.
Select your operating system.
Follow the instructions for your operating system.
Go here to download the latest version of RStudio.
- There is a download option available right there. Click that.
Install R first and then install RStudio
RStudio walkthrough
You can use the basic R console to run your analyses but why drive a Ferrari when you can drive a Tesla? R on its own is incredibly powerful but for no additional cost you can something even better - RStudio. RStudio integrates all aspects of data input, analysis, and output into one piece of software. RStudio looks like this: 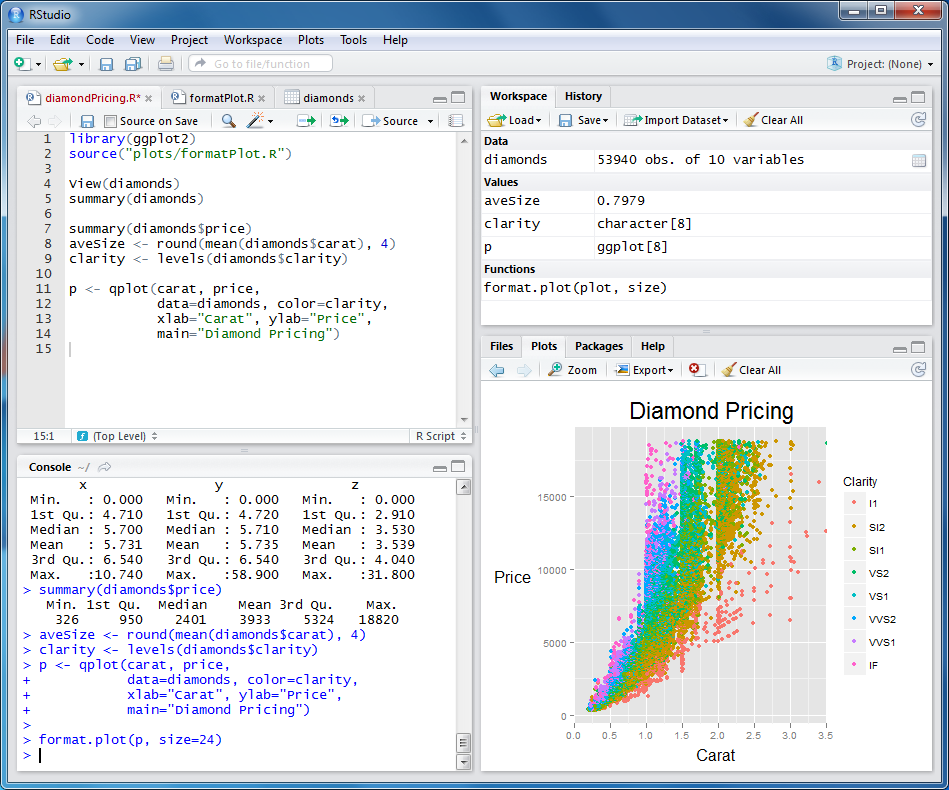 Figure 1: The RStudio IDE. Panel descriptions clockwise from top left: Scripts and object viewer, Environment/History, Files/Plots/Packages/Help/Viewer, Console.
Each of these panes is incredibly useful - their purposes will become self-evident as soon as you start coding. There is also a cheatsheet if you want to get a high-level overview of the IDE. The RStudio environment allows you to quickly reproduce your data analyses. The IDE also contains code “spellcheck” and “grammarcheck” functions along with many shorcut keys and autocomplete suggestions to quickly compete simple funcitons.
Your first R project
The RStudio IDE organises your work in a slightly different manner to traditional statistical software packages. At the base of each project is the working directory. This is the location which contains all information and data relevant to several dependant projects. Think of it like a tree - the working directory is the main trunk and the dependent projects are the branches deviating off of the main trunk. This system makes it easy to move all the information around your computer by keeping it all together. It also allows you to easily share your work with someone else - you just copy the whole directory and pass that on to your collegue.
Making your first project using RStudio’s “Projects” interface is quite simple. RStudio always remembers the location of this working directory and stores a little information file in there to help RStudio to remember what setting you had for that particular directory. To create your first “R Project” follow these quick steps:
Open RStudio
Click
Fileand then clickNew projectChoose
New directoryand thenNew projectEnter the new directory’s name (the root folder) and choose a safe, logical and convienent location for this.
For example - in your OneDrive folder place your directory in a new folder called “R workspace directories”. OneDrive is a great asset but eventually you might find that you are syncing too much data between your R projects and OneDrive. Another alternative is to work with your analyses in your My Documents folder and then copy the working directory to OneDrive periodically to avoid mishaps. Alternatively, you may want to look into other more professional version control systems such as GitHub. There are plenty of other workflows out there but I really encourage you to get to grips with one of them and keep your work neat, structured, and accessable. The working directory would then be entitled “saeon-gsn-intro-workshop” and would appear as ~/saeon-gsn-intro-workshop.
Click on
Create project.Download the required datasets (those files ending in
.csv) from GitHub and place them in your working directory.
The working directory
The working directory is a key element to each of your projects. Each project should ideally have its own working directory. This is the place where R will be reading and writing files to throughout your analysis. Every file that your project needs should be kept within your working directory and every file should be referred to in relation to the root of the working directory.
For your own analyses later you might consider streamlinging your working directories. Once your working directory has been created you could then create subdirectories to store the sepparate parts of your project. To do this click on the Files tab in the lower right pane. Then click the New Folder button. Some examples that might be useful to start with could be:
data_rawto store the raw data. Always keep this separate so that you never loose it or overwrite it. Also be sure to make back ups of your own raw data.data_outputto store any exported data once we have manipulated and analysed the data.figures_outputto store the figures we generate during our analyses.scriptsto store each of the “recipies” that we would use in our data analysis.
For now we will just work in our main working directory.
So how do we "speak" to R?
R is a programming language. This means that it responds to the instructions we give it. We write or code instructions in the R language - just like how you would speak to a French speaking person in French we speak to R in R. Words in human languages are called commands in programming languages. We can interact with R in two ways - using the console or by using script files. Coding in the console is pretty easy - try typing 1+1 into the console (the lower right hand pane) and press Enter and see what happens. This is quite simple - but let us try something a little more complicated. How about (2+4*87/3)^12 - there are not many desktop calculators in the world that could compute that - R carries out the calculation in a split second! The console is a great place to play around with R but is no place for us to stay. Once we close this session of R all the information that we have typed into the console is lost, we can not reproduce it anymore and if we wanted to we would have to sift through a very messy history section. To get around this problem we must move swiftly along and start up our first script!
R scripts allow you to type out multiple functions and then run them all at once. These can then be saved for later reference thus providing an indepth record of what you did to others and even your future self! To create a new script simply go: File > New Fil > R Scrip and the top left hand pane which contains your new script will now become the place where you enter your code.
RStudio allows you to execute commands directly from the script editor by using the Ctrl + Enter shortcut (on Macs, Cmd + Return will work, too). The command where your cursor is currently or all of the commands in the currently selected text will be sent to the console and executed when you press Ctrl + Enter (alternatively you can click the Run option in the top right of the script pane. You can find other keyboard shortcuts in the RStudio IDE cheatsheet.
At some point in your analysis you may want to check the content of a variable or the structure of an object, without necessarily keeping a record of it in your script. You can type these commands and execute them directly in the console. RStudio provides the Ctrl + 1 and Ctrl + 2 shortcuts allow you to jump between the script and the console panes.
If R is ready to accept commands, the R console shows a > prompt. If it receives a command (by typing, copy-pasting or sent from the script editor using Ctrl + Enter), R will try to execute it and, when ready, will show the results and come back with a new > prompt to wait for new commands.
If R is still waiting for you to enter more data because it isn’t complete yet, the console will show a + prompt. It means that you haven’t finished entering a complete command. This is likely because you have not ‘closed’ a parenthesis or quotation, i.e. you don’t have the same number of left-parentheses as right-parentheses, or the same number of opening and closing quotation marks. When this happens, and you thought you finished typing your command, click inside the console window and press Esc; this will cancel the incomplete command and return you to the > prompt. Go back and fix your broken code and run the command again.
Where to find out more later?
This workshop does not aim to provide an exhaustitive introduction to R but rather to get you familiar with its capabilities and lay the foundations required to get started with some basic data manipulation, analyses and visualisations. What I have found very useful is trying to replicate neat analyses that I have seen other people doing. This then exposes me to new methods and develops my capabilities. It also reminds me how important it is to learn to code. If I want to produce Nature quality figures I need to code.
But we are all likely a long way off from there. The best place to start is to go through some fantastic resources developed by Hadley Wickham. He is one of the core developers for RStudio and has spearheaded the development of many of the packages we will be using today. He has written a book called R for Data Science which is a wonderful introduction to transitioning into the R environment. Much of what I have learnt started from there. Once you have mastered that there is a second book with more advanced topics - also freely available.
What happens if I need help?
That is the great thing about R. The community supporting it is open to sharing ideas and helping one another problemsolve. When you get an error message the best thing to do is to copy it into Google and see what is being said about it. Consider including the phrase “R” and the package or function you are using which produces the error. I mentioned a few places earlier but just as a reminder and to extend the list great places to look for help are:
Stackoverflow
R bloggers
Crossvalidated
Specific package "vigenettes"
R also has a fantastic built-in help function. Each package that is loaded on the CRAN repository must include a manual detailing every aspect of the package. These can be confusing to understand at first but you will soon get the hang of it with time. Each function within the manual contains a description as well as an example of how to use the function.
From within R you can call up the help files for any function that is contained within your library (the library is a place where all your packages are installed). The function lm() computes a “linear model” (a.k.a linear regression) for x and y variables. If we didn’t know how it worked we could call up the function by typing ?lm into the console. The lower right pane would then display the lm() help file. But let’s say we want to run an analysis of variance but we don’t know what the function is. We can type ??analysisofvariance (note that R ignores spaces in this search option) into the console and a number of possible topics would be displayed in the lower right pane for us to read. We could then quickly see that the aov() function is what we need to look at to “Fit an Analysis of Variance Model”.